August 2026 — Full Month Results
A month with a built-in before-and-after. The panels were down for yard landscaping Aug 1–11, and the studio drew 3–8 kWh a day from the grid. Once they were back up on Aug 12, net grid use dropped to near zero, with net export on several days. The mini split was about 88% of the studio's electricity use.
Solar Production
34.4 kWh
~20 days of production · panels down Aug 1–11 · Craftstrom
HVAC Consumption
78.0 kWh
Full month · 2.5 kWh/day avg · mini split circuit · Emporia
Net Grid Import
54.1 kWh
Full month · studio mains, net of solar · Emporia
HVAC Share of Load
~88%
Of ~88.5 kWh gross use (net import + solar)
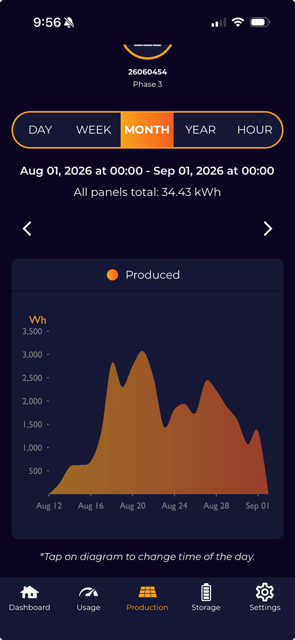
34.43 kWh. Zero output Aug 1–11 while the panels were removed for landscaping. The app smooths daily values into a curve.
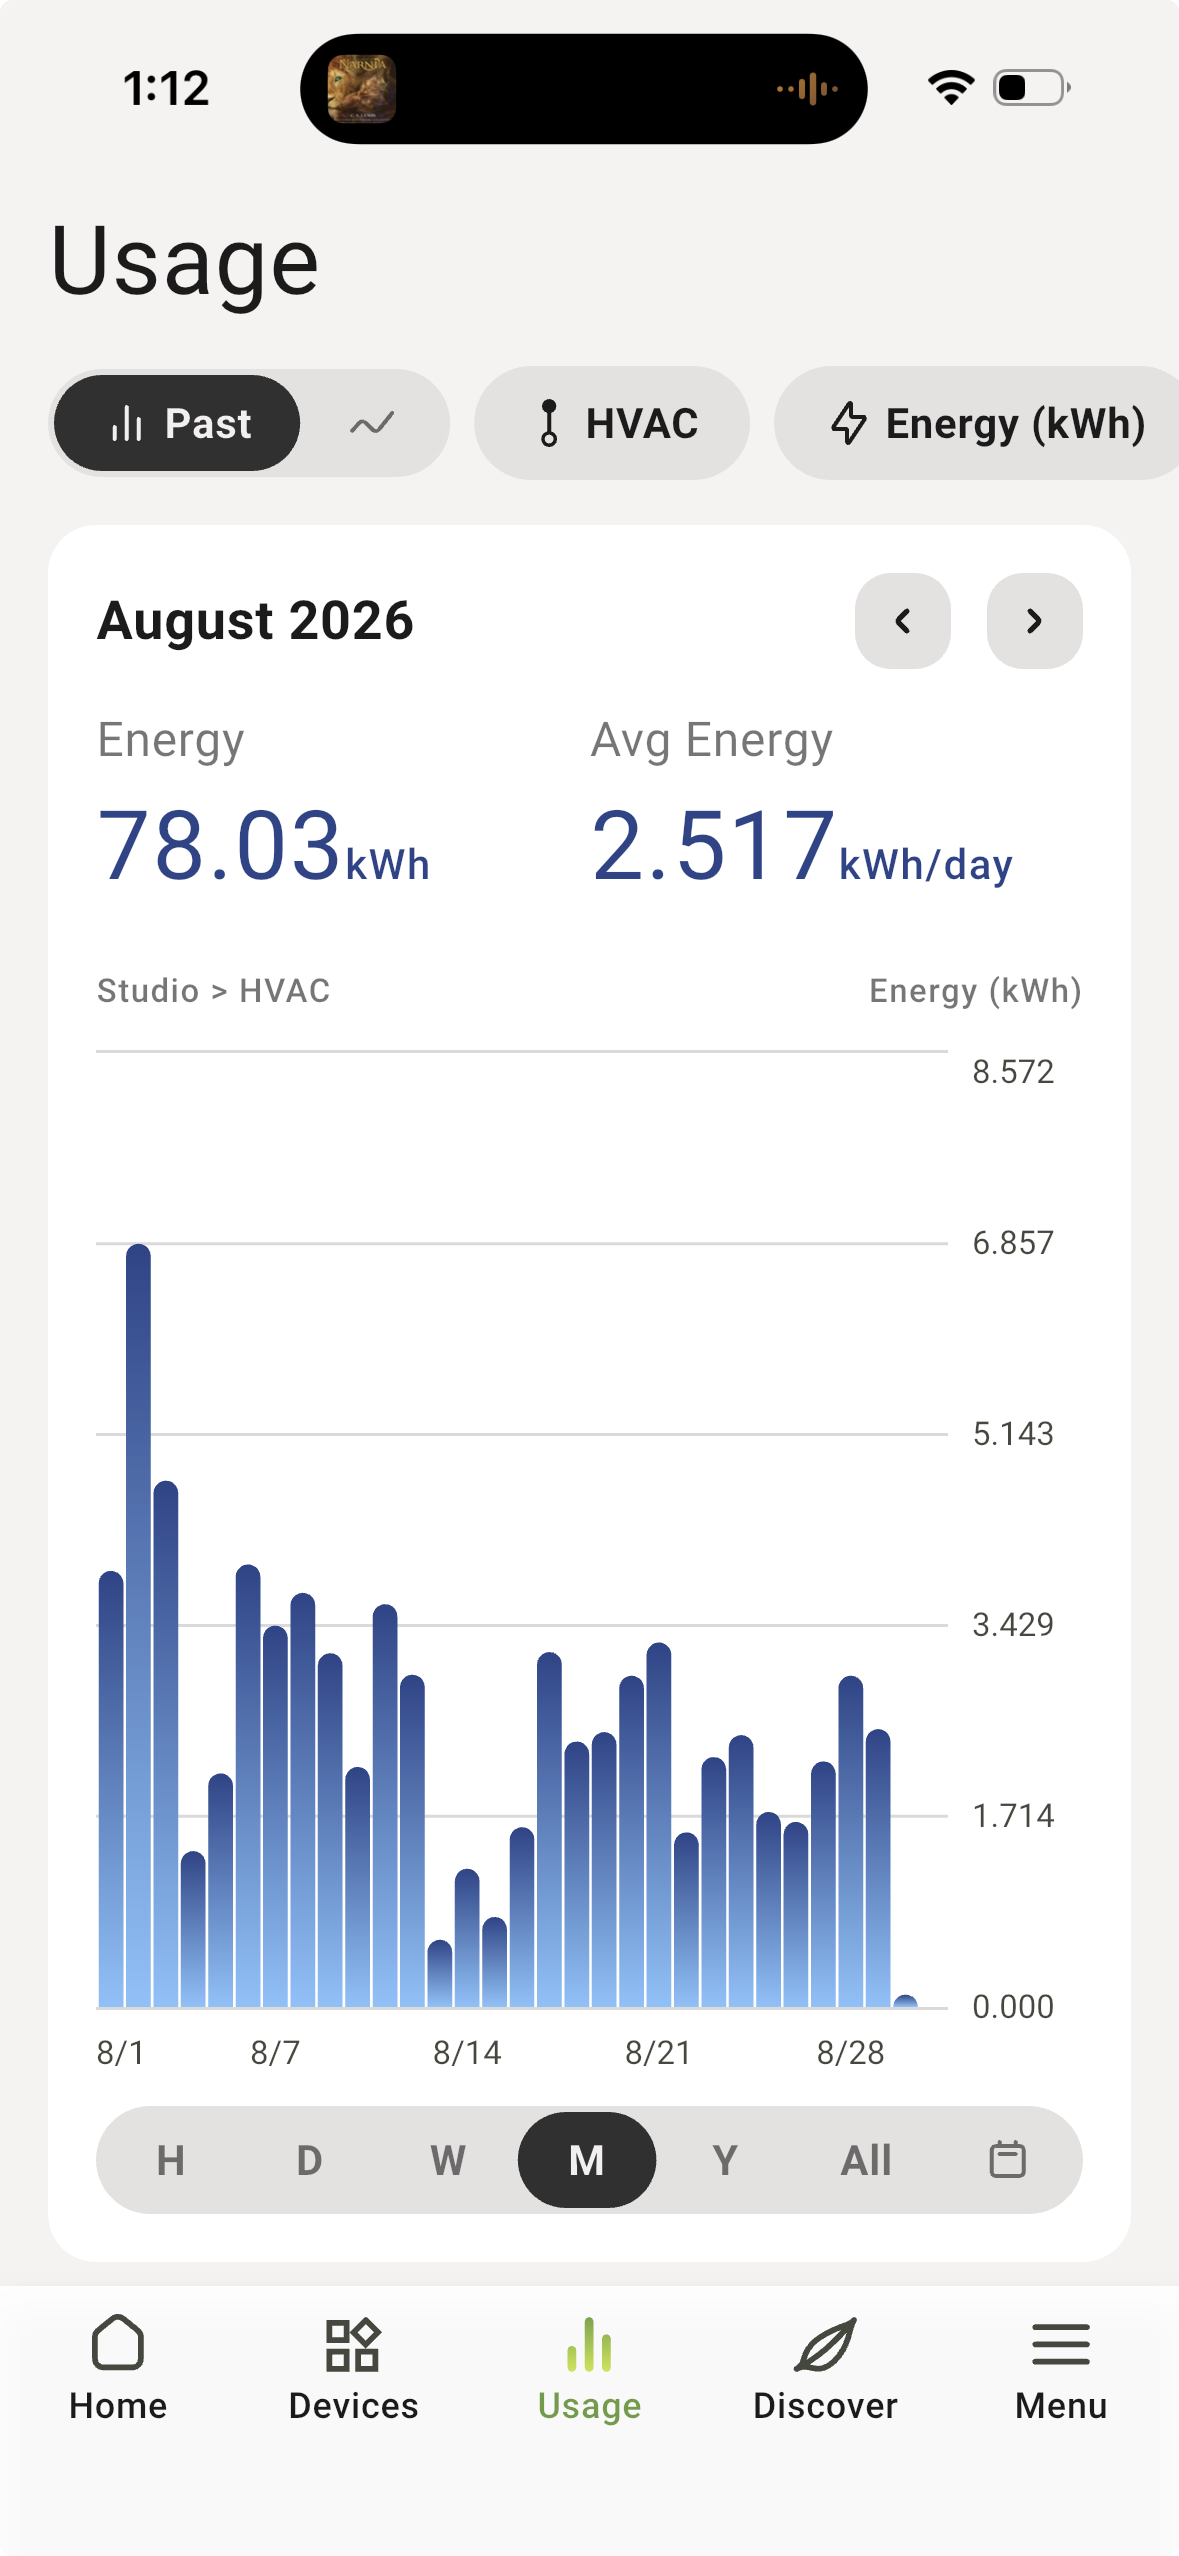
78.03 kWh on the isolated mini split circuit. Peak day ~6.8 kWh during the early-August heat; cool dip around Aug 12–14.
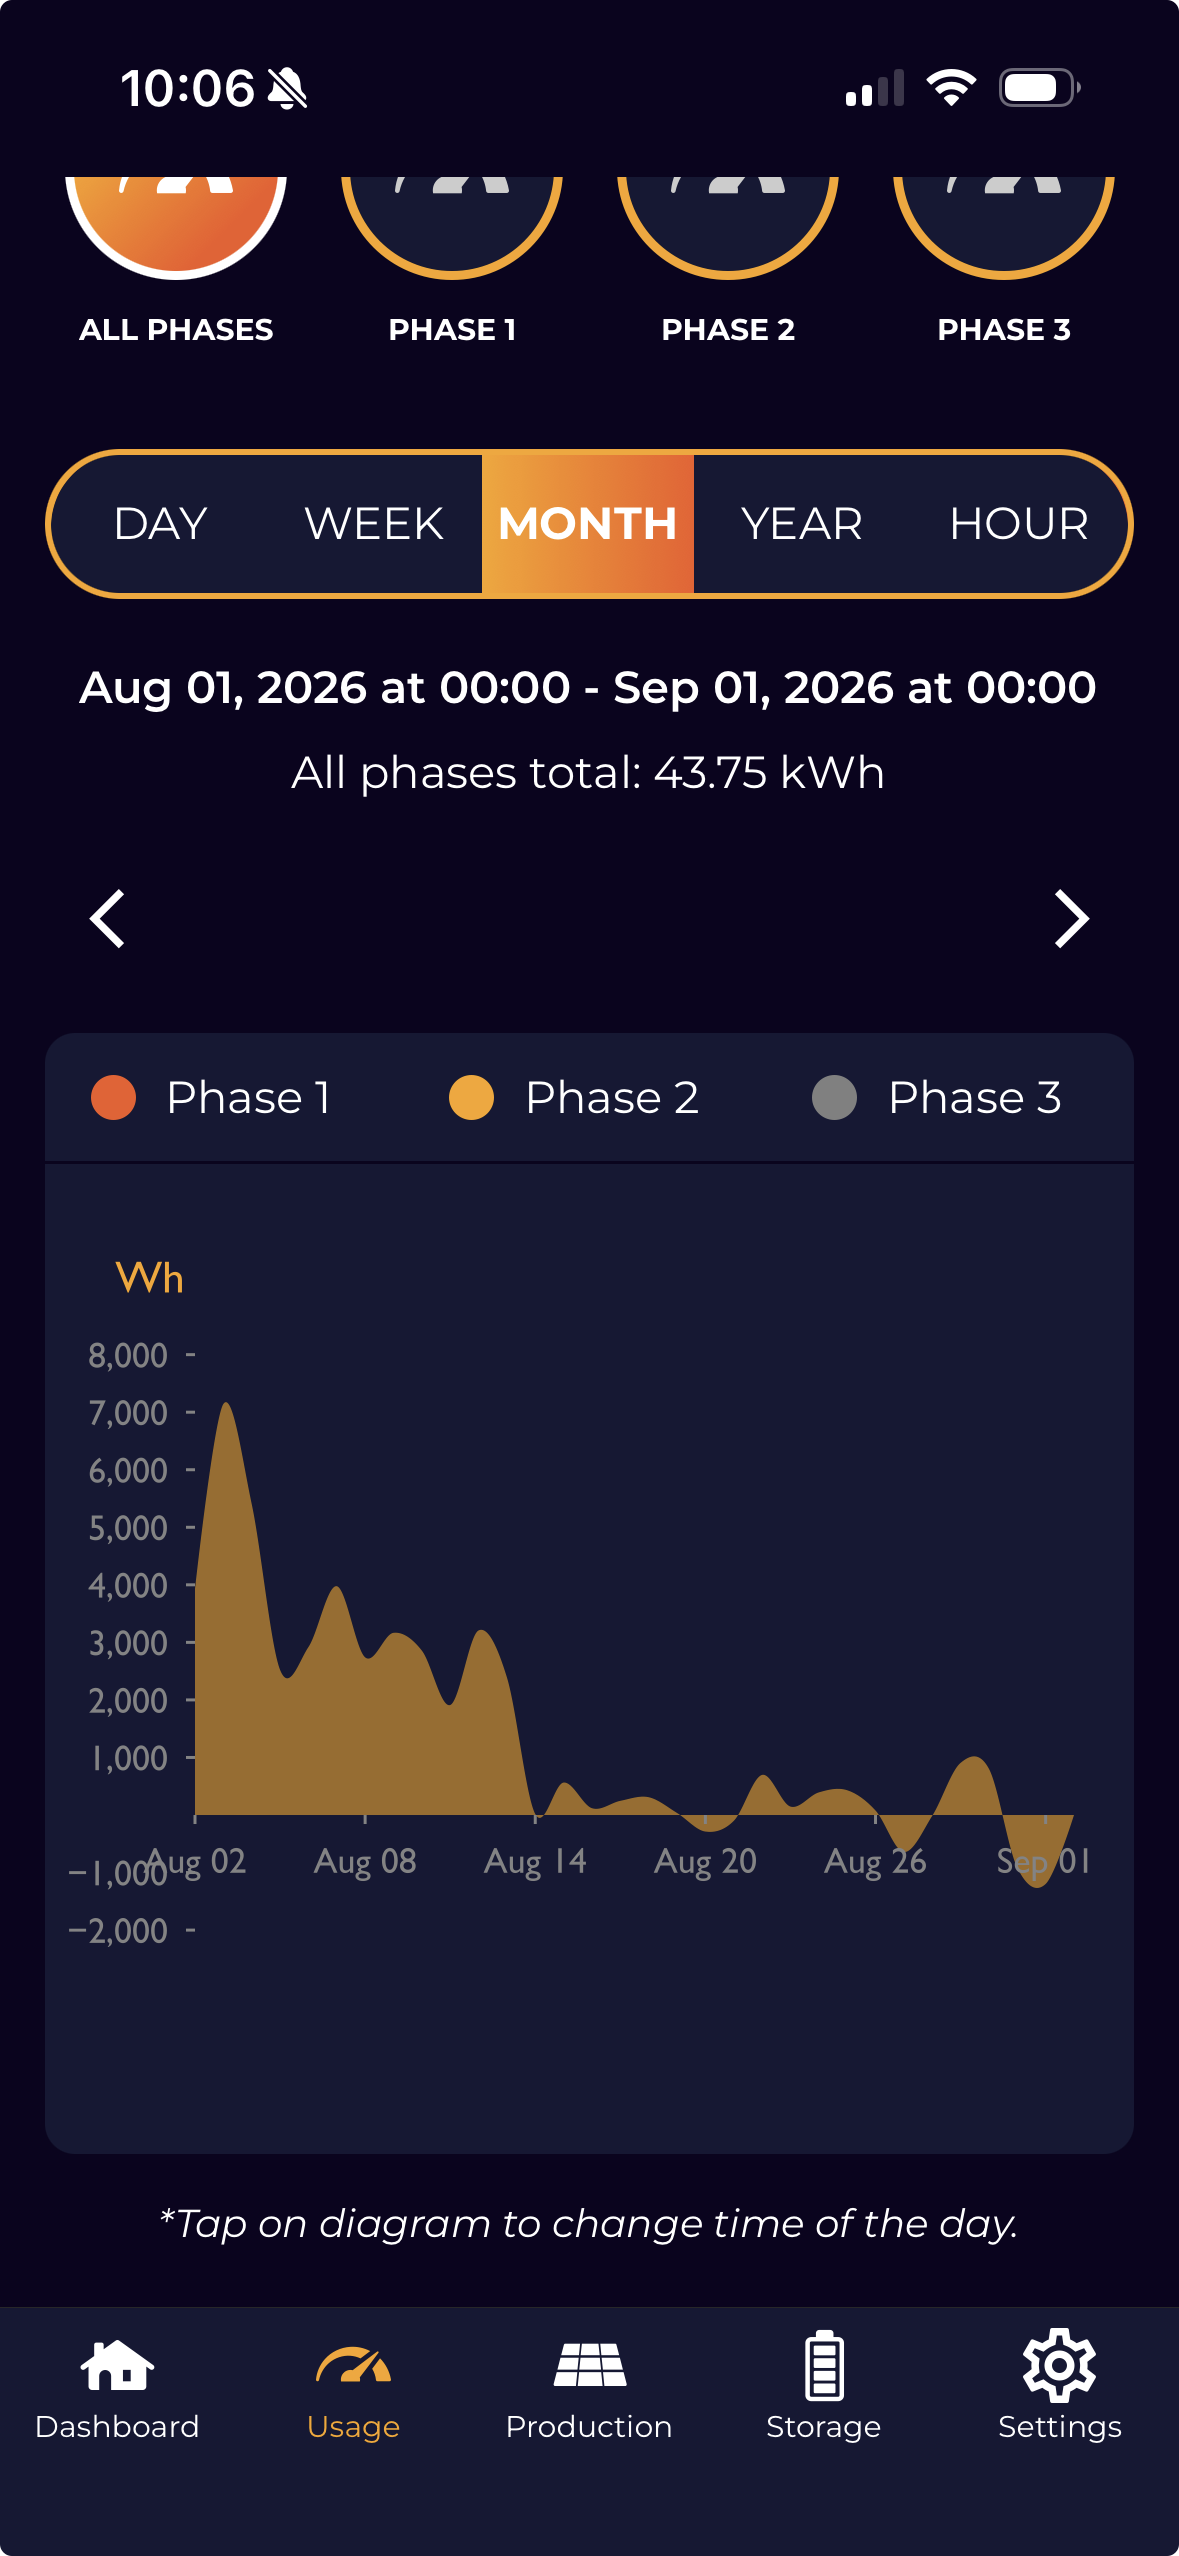
Net import as seen by the Craftstrom PowerMeter (43.75 kWh). Reads ~10 kWh below Emporia; see methodology.
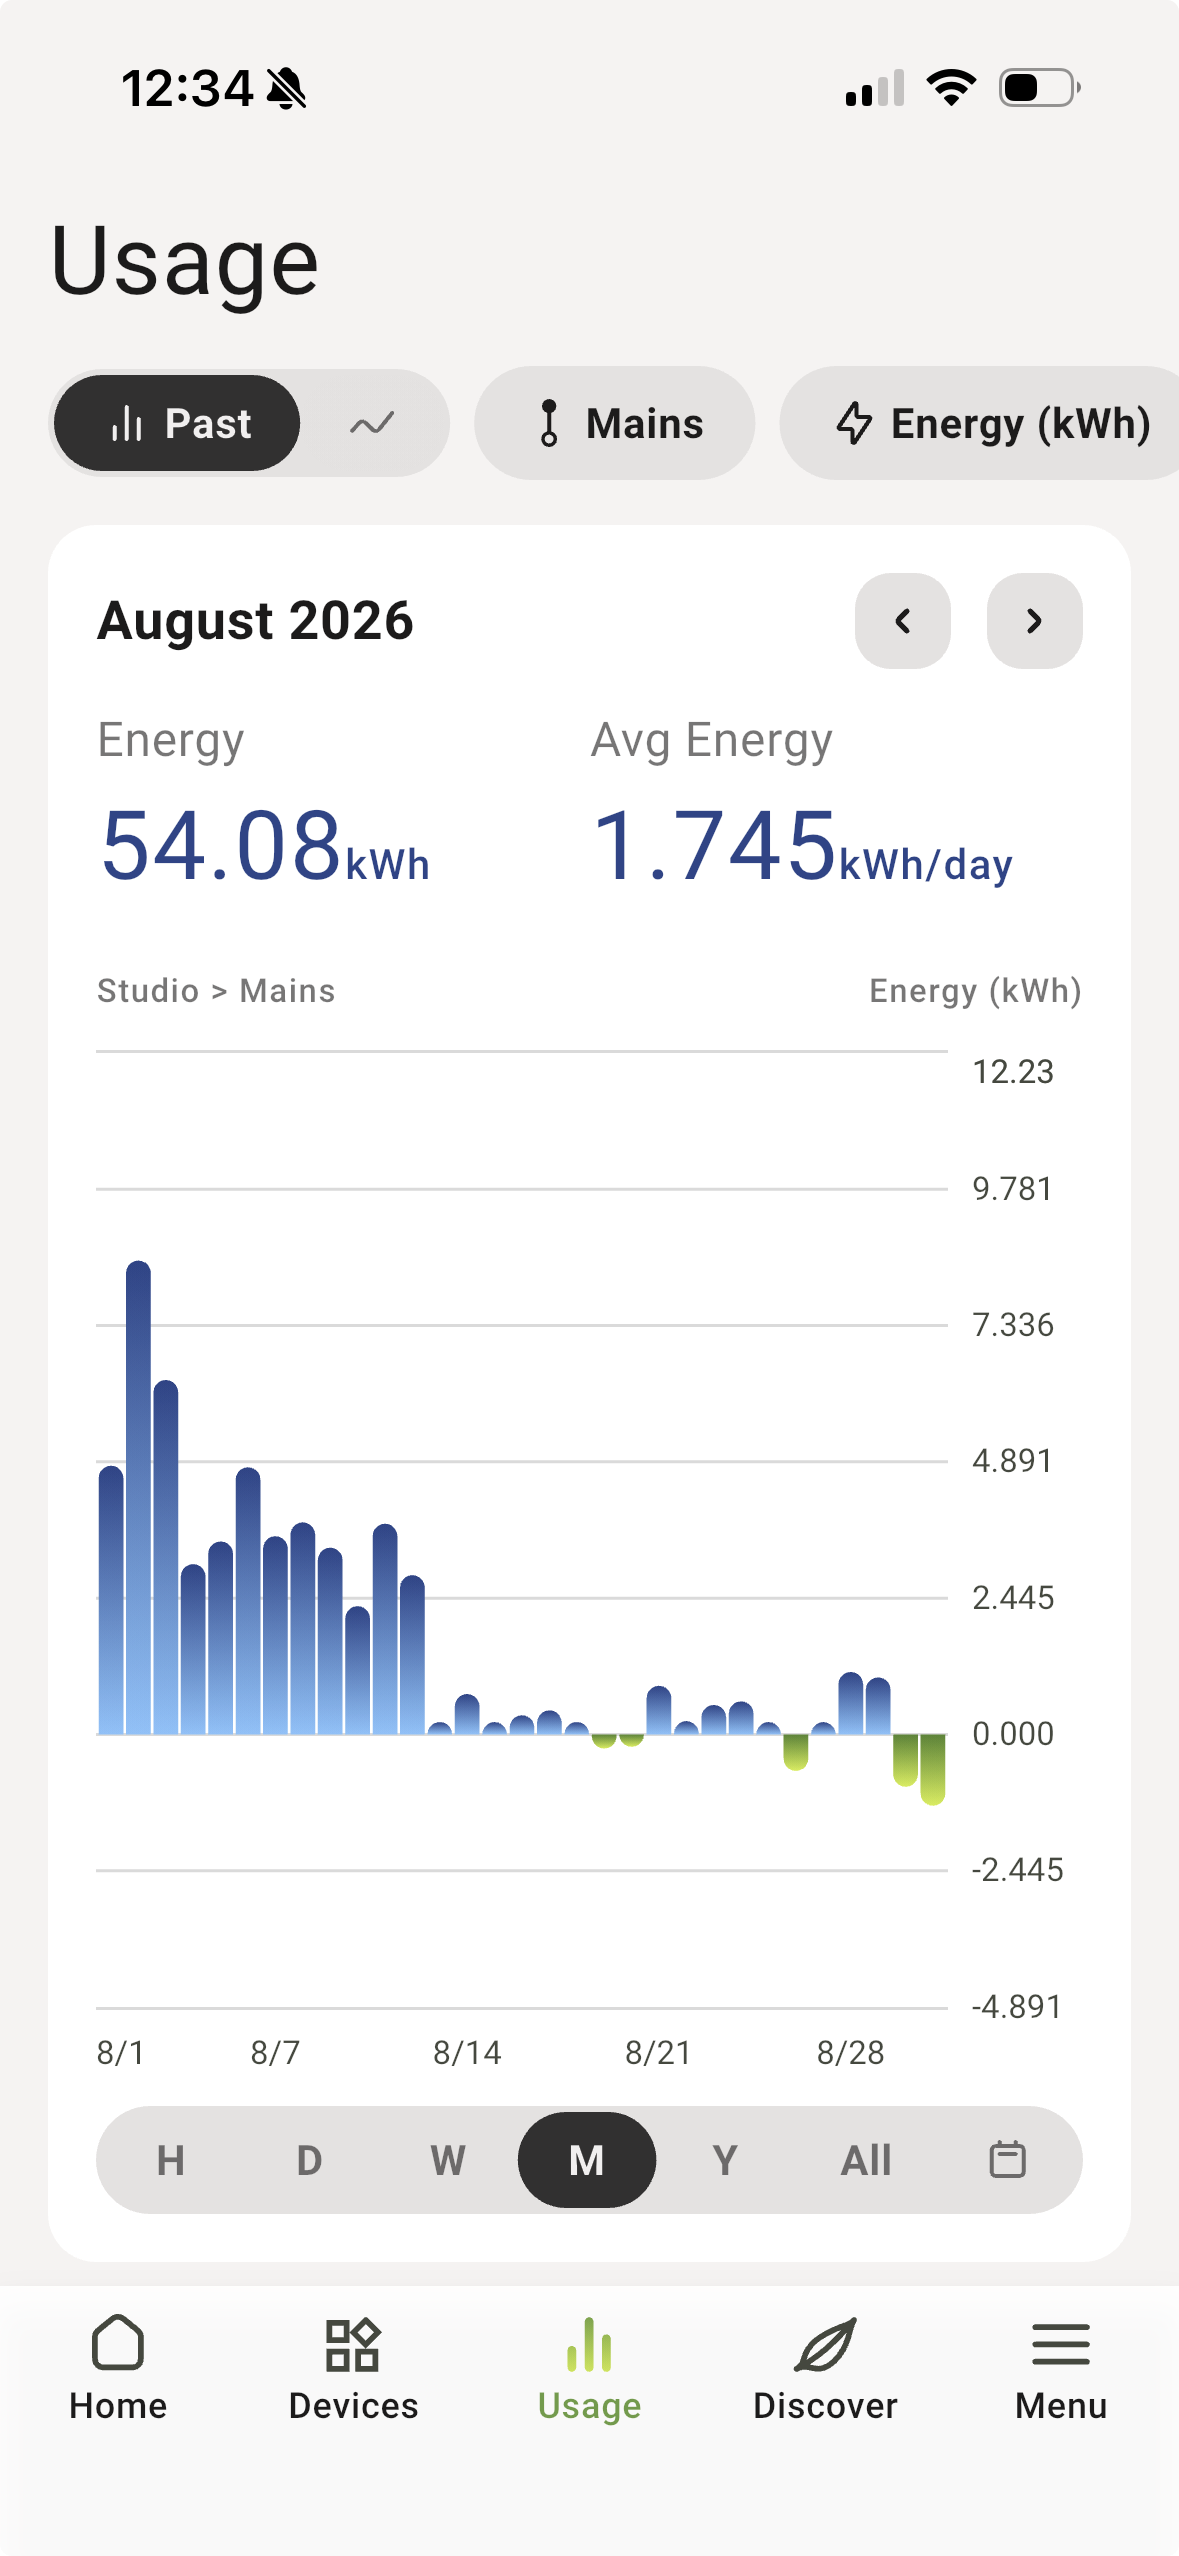
54.08 kWh net from the grid. Green bars below zero are days the studio exported solar.
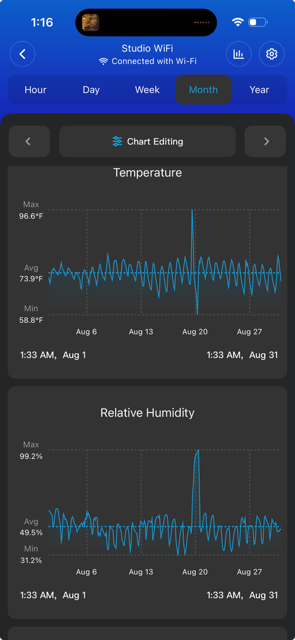
Average 73.9°F and 49.5% RH; typically 68–78°F and 40–55% RH. The spike around Aug 19–20 (96.6°F, 99% RH) is a sensor artifact: the sensor was temporarily used to measure temperature under the solar panels. It does not reflect indoor conditions.
August notes
- Panels removed Aug 1–11 for yard landscaping and reinstalled Aug 12 in the same location. The solar total reflects ~20 days of production.
- At month's end the array was relocated further south after the grass beneath it began yellowing, a practical consideration for ground-mounted plug-in solar. September is the first month at the new location.
- The studio is occupied and in regular daily use; these are lived-in conditions, not an empty test cell.
- Govee window runs Aug 1 – Aug 31 at 1:33 AM (last day not shown).
Monthly History
Every month since monitoring began. Screenshots for earlier months are archived and available on request.
| Month | Solar | HVAC | Net grid import | Notes |
|---|---|---|---|---|
| May 2026 | 59.6 kWh | 52.9 kWh* | 66.8 kWh*† | *Monitoring from May 10. Hourly HVAC CSV |
| June 2026 | 70 kWh | 112 kWh | 96 kWh† | First full cooling month. Temperature CSV |
| July 2026 | — | — | — | Data being added. One microinverter failed during the month; replaced by the vendor. |
| August 2026 | 34.4 kWh | 78.0 kWh | 54.1 kWh | Panels down Aug 1–11 for landscaping. |
† May and June were originally published as "Total Panel Consumption." Both the Emporia and Craftstrom mains readings are net of solar, so these figures are net grid import, not gross consumption; gross use is net import plus solar. HVAC can therefore exceed the net figure, as it did in June.
What We're Measuring
Full-stack instrumentation across solar generation, circuit-level consumption, HVAC load profiles, and indoor conditions.
Solar Production
Gross production from both HEDY microinverters. Per-inverter and combined views. Daily, weekly, monthly totals.
Craftstrom PowerMeterWhole Panel Consumption
Net import/export at the studio mains. Gross consumption (HVAC, lighting, and receptacle loads) is net import plus solar production.
Emporia Vue 2HVAC Circuit (Isolated)
Mini split consumption isolated on its own circuit. Compressor cycling, startup surge, steady-state draw at various setpoints.
Emporia Vue 2Lighting Circuit
Studio lighting consumption isolated. Low-draw LED baseline documented for system design reference.
Emporia Vue 2Receptacles + Solar Net
Plug-in solar output net of receptacle loads. Shows real self-consumption from the plug-in solar system.
Emporia Vue 2Indoor Temperature & Humidity
10-minute interval indoor conditions. Paired with HVAC consumption data to show real-world thermal performance of the Studio Shed.
Govee H5179Battery Storage (New Project)
A Bluetti portable power station is joining the testbed. Charge/discharge behavior, solar charging, and backup runtime for plug loads will be documented here as the project unfolds.
Bluetti · Follow the project →Indoor Air Quality (Coming Soon)
Airthings Wave Plus arriving soon — CO2, VOCs, humidity, radon, and temperature. Baseline monitoring before installation of a Swerv window-mounted ERV. Before/after ventilation impact documented publicly.
Airthings · Swerv ERV · PendingMethodology & Transparency
All data is collected from consumer-grade monitoring equipment in a real residential setting in Centennial, Colorado (USDA Hardiness Zone 5b). The Studio Shed is a 10×12 structure (R-15 walls, R-25 roof, uninsulated slab edge) with a heavily glazed south wall, a Fujitsu AOU9RL2 115V mini split, and an 800W Craftstrom plug-in solar system. It is occupied and in regular daily use.
Consumption figures come from the Emporia Vue 2 (isolated HVAC circuit and studio mains); solar production comes from the Craftstrom app. Both mains readings are net of solar, so gross consumption is calculated as net import plus solar. The Craftstrom PowerMeter reads roughly 10 kWh/month lower than Emporia, likely because it does not see every load in the subpanel; we use Emporia as the reference for consumption.
Screenshots are taken from the Craftstrom, Emporia, and Govee apps and posted monthly without editing. We note any anomalies or data gaps in the monthly summary. Our goal is honest field documentation, not marketing.
Have questions about the data or methodology? Reach out at diana@ecosnap.us
Electrifying your own small space?
Join our early access list and be first to know when EcoSnap pilot installs open in your area.